- This topic has 5 replies, 3 voices, and was last updated Mar-239:56 am by
 BryanAdams.
-
AuthorPosts
-
-
Up::2
Hi guys,
I am struggling with 2 following problems, if you are expert please help to explain. Thank you so much for you time and I wish you all the best !
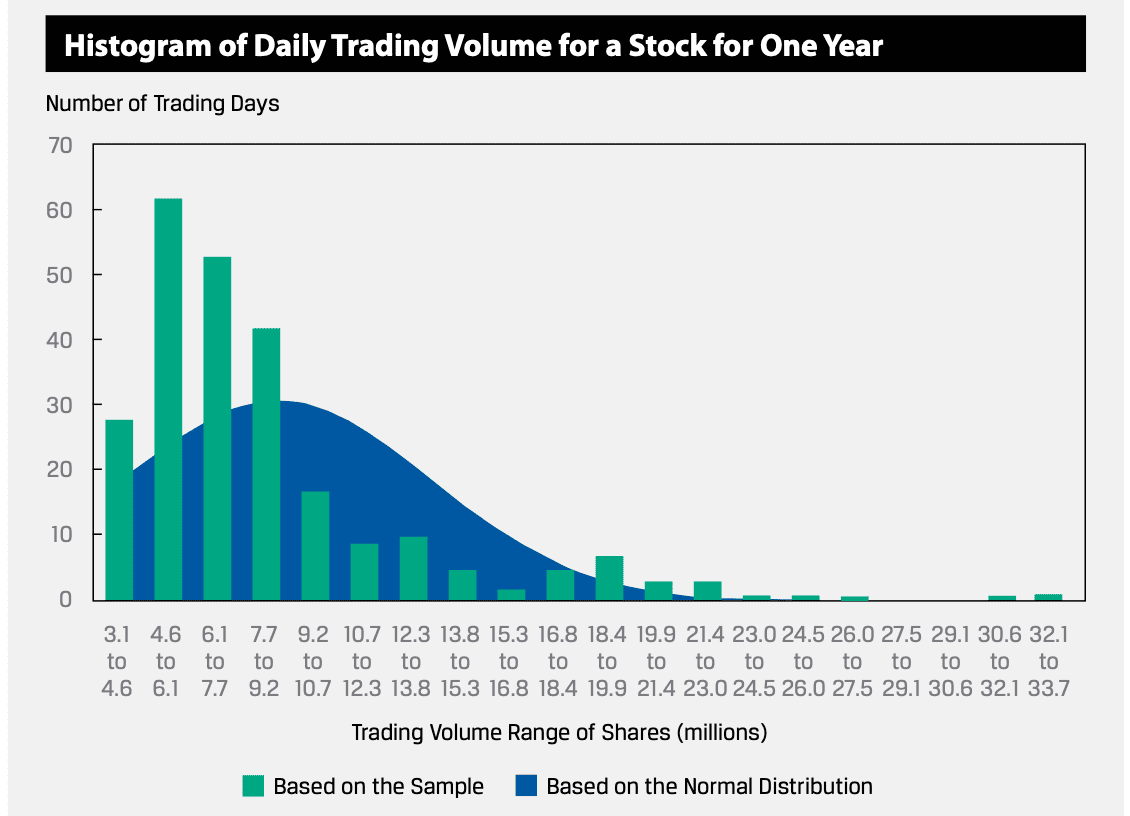
Problems 1: Consider the daily trading volume for a stock for one year, as shown in the graph below. In addition to the count of observations within each bin or interval, the number of observations anticipated based on a normal distribution (given the sample arithmetic average and standard deviation) is provided in the chart as well. The average trading volume per day for this stock in this year is 8.6 million shares, and the standard deviation is 4.9 million shares.
<div class=”page” title=”Page 155″>
<div class=”section”>
<div class=”layoutArea”>
<div class=”column”>
<div class=”page” title=”Page 156″>
<div class=”section”>
<div class=”layoutArea”>
<div class=”column”>- Describe whether or not this distribution is skewed. If so, what could account for this situation?
- Describe whether or not this distribution displays kurtosis. How would you make this determination?
<div class=”page” title=”Page 156″>
<div class=”section”>
<div class=”layoutArea”>
<div class=”column”>Solution to 1
The distribution appears to be skewed to the right, or positively skewed. This is likely due to: (1) no possible negative trading volume on a given trading day, so the distribution is truncated at zero; and (2) greater-than-typical trading occurring relatively infrequently, such as when there are company-specific announcements.
The actual skewness for this distribution is 2.1090, which supports this interpretation.
=> Could anyone explain how to calculate the skewness in this case?
Solution to 2
The distribution appears to have excess kurtosis, with a right-side fat tail and with maximum shares traded in the 4.6 to 6.1 million range, exceeding what is expected if the distribution was normally distributed. There are also fewer observations than expected between the central region and the tail.
The actual excess kurtosis for this distribution is 5.2151, which supports this interpretation.
=> Could anyone explain how to calculate the kurtosis in this case?
</div>
Problem 2:
<div class=”page” title=”Page 173″>
<div class=”section”>
<div class=”layoutArea”>
<div class=”column”>23 The annual returns for three portfolios are shown in the following exhibit. Portfolios P and R were created in Year 1, Portfolio Q in Year 2.
</div>
</div>
<div class=”layoutArea”>
<div class=”column”></div>
</div>
<div class=”layoutArea”>
<div class=”column”>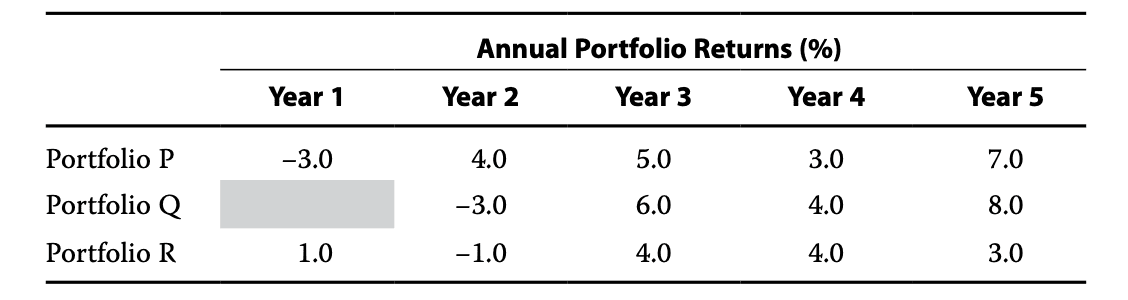
</div>
</div>
<div class=”layoutArea”>
<div class=”column”>The median annual return from portfolio creation to Year 5 for:
- A Portfolio P is 4.5%.
- B Portfolio Q is 4.0%.
- C Portfolio R is higher than its arithmetic mean annual return.
</div>
=> The answer is C and The median of Portfolio R is 0.8% higher than the mean for Portfolio R.=> Could anyone please explain how to calculate median and mean in this problem?
</div>
</div>
</div>
</div>
</div>
</div>
</div>
</div>
</div>
</div>
</div>
</div>
</div>
</div> -
Up::0
For Example 21 Interpreting Skewness and Kurtosis,
the first paragraph of the solutions provided are the answers based on the histogram alone. The second paragraph is data that only the authors of the question would have; they’re just giving you the data to validate their justifications in the first paragraph.
For Practice Problem #23,
How to calculate median – https://www.investopedia.com/terms/m/median.asp
The answer is C (Portfolio R is higher than its arithmetic mean annual return) because it is true and because A and B are untrue.
-
-
Up::0
But according to the median formular, the median for Portfolio R should be 3 ??? Why the solution is 0,8%
-
-
-
AuthorPosts
- You must be logged in to reply to this topic.