- This topic has 1 reply, 2 voices, and was last updated Apr-218:31 pm by
mikey.
-
AuthorPosts
-
-
Up::2
What is a confidence interval?
A confidence interval is basically the probability that our outcome will occur within an interval or range in a distribution.
In other words, it’s the confidence (probability) we have that our outcome will be within the interval → confidence interval.
For example, here’s a statement about normal distributions:
In a normal distribution, 68% of all values fall within 1 standard deviation from the mean.
In fact, for a normal distribution (i.e. z-values), there are four very commonly-used sets of parameters:
Confidence interval Z-value (normal distribution) 68% 1 90% 1.645 95% 1.96 99% 2.576 This means that a normal distribution graph has a mean of 0, with:
- 68% of the graph area within ±1 of the x-axis
- 90% of the graph area within ±1.645 of the x-axis
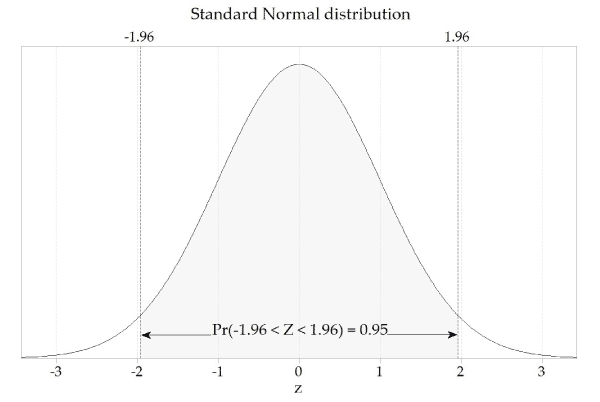
- 95% of the graph area within ±1.96 of the x-axis
- 99% of the graph area within ±2.576 of the x-axis
For example, here’s a graph showing a normal distribution with the values within the 95% confidence interval highlighted:
So that’s all good, but what if you want to use it with a population with its own mean value and its own variation/variance?
This formula allows you to scale it to any sample, assuming a normal distribution curve (we’ll get to this later):
So what does ‘assuming a normal distribution curve’ mean? When can we do that?
For that, we look to something called the Central Limit Theorem. The Central Limit Theorem states that when independent random variables are added to a population, as the number of variables (n) increases, the population will tend towards a normal distribution.
In other words, a large enough population can in most cases be safely assumed to be normally distributed.
How large? This is usually accepted to be ‘more than 30 datapoints’, i.e. n > 30.
So if n > 30, you can assume that your distribution can be modelled with this equation:
If you can be more specific with your question I can help better.
-
-
AuthorPosts
- You must be logged in to reply to this topic.